10 Best Technical Services for Global Buyers

Global buyers are no longer purchasing equipment alone. They are purchasing uptime, integration, cybersecurity, training, and measurable support. That shift makes technical services a strategic business decision, not an after-sales detail.

Gartner forecasts worldwide IT spending will reach approximately $5.61 trillion in 2025, reflecting continued investment in digital infrastructure and operational technology. The International Data Corporation also projects global digital transformation spending will approach $4 trillion by 2027. These figures reveal strong demand, but they do not guarantee service quality. A sophisticated platform can still fail when installation is rushed, documentation is unclear, or local support is unavailable.

The stakes are tangible. A delayed replacement part can stop a production line. A weak integration can distort inventory data across three countries. A poorly trained team may ignore a warning until the damage becomes expensive. This article examines 10 best technical services for global buyers, including implementation, remote monitoring, maintenance, cybersecurity, localization, and compliance support. The selection focuses on practical value, provider experience, response times, transparent service-level agreements, and evidence from recognized industry research.

No ranking is perfectly universal. A small importer may value fast remote assistance, while a multinational manufacturer may require 24-hour coverage and regional engineers. Buyers should therefore compare case studies, certifications, escalation procedures, and total ownership costs. Gartner’s research is influential, but it cannot replace site-specific testing. That is an important limitation. The strongest technical services provider is not always the largest one; it is the partner that understands the buyer’s equipment, risks, markets, and people.

10 Best Technical Services for Global Buyers

Defining Technical Services: A $1.5 Trillion Global IT Services Market (Gartner)

10 Best Technical Services for Global Buyers

Defining Technical Services: A $1.5 Trillion Global IT Services Market (Gartner)

Technical services turn business requirements into working digital systems. They include cloud migration, cybersecurity, software development, data engineering, and infrastructure management. Other essential areas include system integration, technical support, disaster recovery, IT consulting, and automation.

Gartner estimates the global IT services market at approximately $1.5 trillion. This figure shows the market’s scale, but it does not guarantee service quality. Buyers still need practical evidence. Request project references, response-time records, security controls, and clear ownership terms. A polished proposal can hide weak delivery processes.

The best provider understands local regulations, language needs, time zones, and industry risks. A dependable team documents every change and explains technical decisions in plain language. During a cloud migration, experienced engineers check access permissions, backup recovery, and application dependencies before moving data. Small oversights can create expensive delays.

No provider is perfect. That matters. Global buyers should test support during a limited pilot before signing a large contract. They should also review exit plans, data portability, and renewal pricing. We have seen projects fail because teams measured speed, but ignored maintenance capacity. Technical expertise needs operational discipline.

10 Best Technical Services for Global Buyers

Defining Technical Services: A $1.5 Trillion Global IT Services Market

Global IT services spending was forecast to reach approximately $1.5 trillion in 2024. The market covers consulting, implementation, managed services, infrastructure support, application services, cybersecurity, cloud operations, data services, technical support, and systems integration. These services help global buyers improve operational efficiency, scalability, resilience, and digital transformation outcomes.

Source: Gartner, worldwide IT spending forecasts. Values are rounded estimates in U.S. dollars.

The 10 Core Services Driving Global Buyer Efficiency and Innovation

Global buyers need more than a catalog and a low quotation. They need technical services that reduce uncertainty at every handover.

The World Trade Organization estimates that full Trade Facilitation Agreement implementation could lower trade costs by 14.3%. That saving depends on accurate documents, coordinated inspections, and dependable shipment data.

The World Bank’s 2023 Logistics Performance Index compares 139 economies across six logistics dimensions. Its framework highlights customs, infrastructure, shipment quality, competence, tracking, and timeliness. These areas directly shape buyer efficiency.

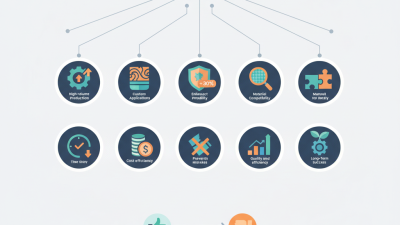
A practical ten-service stack includes requirements engineering, supplier qualification, and prototype testing. Quality inspection, regulatory documentation, and cybersecurity review protect the handover.

Integration support, predictive maintenance, technical training, and after-sales analytics extend usable value. On the factory floor, one missing tolerance can create weeks of rework. Small details hurt.

Dashboards can also mislead when data arrives late or lacks context. Buyers should verify test methods, service response times, spare-part access, and technician qualifications before signing. ISO 9001-based controls can improve traceability, but certification alone cannot prove technical competence. Human review still matters, especially when a component behaves differently under heat, vibration, or heavy use.

Cloud, AI, and Data Services: Gartner’s $679.8 Billion Cloud Forecast

The $679.8 billion cloud forecast signals a major shift in global technology spending. Cloud services now support daily operations, not just experimental projects. Buyers are seeking flexible infrastructure, AI tools, and reliable data platforms. The strongest providers connect these services to measurable business needs. They explain costs clearly and show how systems perform under pressure.

For global buyers, technical evaluation should begin with practical evidence. Ask for migration timelines, security controls, service-level records, and recovery procedures. A supplier should demonstrate how data moves between regions. It should also explain local compliance responsibilities in plain language. Small details matter. A delayed backup can disrupt an entire sales operation.

AI services need even closer examination. Faster models do not guarantee better decisions. Buyers should test accuracy, bias controls, human review, and data access limits. One weakness remains common: teams underestimate integration work. An impressive demonstration may hide expensive maintenance. Careful buyers should request a working pilot with real workflows, but protected information. The forecast is substantial, yet spending alone cannot prove value.

Cybersecurity and Compliance: Protecting Buyers in a $215 Billion Market

In a $215 billion global market, technical services help buyers manage more than price and performance. They must also protect data, payment records, and operational access. A credible provider should explain its security controls in plain language. Buyers need evidence, not polished promises. Ask for access policies, incident response procedures, encryption details, and recent independent assessments.

A practical review can begin with a simple test. Request a sample security questionnaire. Check how quickly the provider identifies unclear requirements. Strong teams document who can access customer information, when access is reviewed, and how former staff are removed. They also map services to relevant privacy, cybersecurity, and industry obligations in each operating region. Small gaps matter. A forgotten shared account can expose an entire project.

Compliance is not a one-time certificate on a website. Contracts should define breach notification duties, data retention periods, audit rights, and subcontractor oversight. Technical testing may include vulnerability scans, secure configuration reviews, and controlled recovery exercises. Ask for dated reports and corrective actions. Evidence ages quickly.

There is room for doubt. A clean assessment can still miss weak internal habits. Buyers should test real workflows, not only documents. One useful exercise involves a simulated employee departure and an urgent access request. The results often reveal delays, unclear ownership, or excessive permissions. Independent legal and security advice remains valuable when rules differ across borders.

Evaluating Providers by ROI, SLAs, Security, and Global Delivery Standards

For global buyers, the “best” technical service is not the cheapest hourly option. It is the provider that converts reliable delivery into measurable business value. Compare total cost, avoided downtime, deployment speed, and support coverage across regions. The 2024 Annual Outage Analysis reported that 54% of organizations experienced outages costing more than $100,000. That figure makes uptime a financial metric, not merely an engineering preference.

Read the SLA carefully. It should define response times, restoration targets, service credits, escalation paths, and regional support hours. Ask for evidence from similar markets, not polished promises. A provider serving three time zones may still fail during a local holiday. Small detail, serious impact. Security deserves equal weight. The 2024 Cost of a Data Breach Report placed the global average breach cost at $4.88 million. Require documented access controls, encryption, incident reporting, backup testing, and independent audit evidence.

Global delivery also depends on practical discipline. Evaluate language coverage, data residency procedures, subcontractor oversight, and change-management methods. The World Quality Report 2023–24 found that 67% of organizations prioritize quality engineering for digital transformation, yet quality often remains difficult to measure consistently. That gap should influence your scorecard. Use weighted criteria, such as ROI at 30%, SLA performance at 25%, security at 25%, and delivery reach at 20%. I would still challenge those weights. A highly regulated buyer may need security to dominate the decision. No scorecard is perfect. Test the provider with a limited project, inspect real incident records, and measure results before expanding the contract.

10 Best Technical Services for Global Buyers — Evaluating Providers by ROI, SLAs, Security, and Global Delivery Standards

An anonymized benchmark of technical-service provider profiles. Scores use a 100-point weighted model covering measurable business value, service-level commitments, security controls, geographic delivery, implementation risk, and commercial transparency.

Rank Service Profile Primary Buyer Outcome Estimated 3-Year ROI Range Typical Payback Period Core SLA Commitment Service Credits / Remedy Security and Compliance Coverage Global Delivery Standard Implementation Timeline Commercial Transparency Weighted Evaluation Score
1 Managed Cloud Infrastructure Operations Improves availability, reduces infrastructure administration, and supports predictable capacity planning. 28%–42% 9–16 months 99.95%–99.99% monthly availability; 15–30 minute priority-one response Service credits tied to monthly availability and documented incident severity ISO 27001 SOC 2 Type II Encryption in transit and at rest Follow-the-sun support, regional data-residency options, documented change management 8–16 weeks Unit pricing, consumption reporting, and separately itemized migration fees 92/100
2 Cybersecurity Monitoring and Incident Response Shortens threat-detection time and reduces the operational impact of security incidents. 22%–38% 10–20 months 24/7 monitoring; critical-alert triage within 15 minutes; escalation within 30 minutes Corrective-action plans, incident reporting, and contracted response-time remedies ISO 27001 SOC 2 Type II NIST CSF alignment MFA Security operations coverage across multiple time zones with multilingual escalation procedures 6–12 weeks Clear log-volume thresholds, retention charges, and analyst-hour assumptions 90/100
3 Enterprise Software Integration Connects finance, supply-chain, customer, and operational systems while reducing manual data transfer. 24%–36% 12–24 months 99.9% integration-platform availability; defined interface recovery objectives Milestone-based acceptance, defect correction windows, and limited retesting at no extra charge ISO 27001 API authentication Role-based access Audit logging Regional implementation teams, standardized API documentation, and local data-protection assessments 12–24 weeks Fixed-price discovery phase with transparent change-request pricing 88/100
4 Data Engineering and Analytics Platforms Creates governed data pipelines, improves reporting speed, and supports repeatable decision-making. 20%–35% 14–26 months 99.9% pipeline availability; agreed data-freshness and recovery targets Data-quality remediation, root-cause analysis, and service-level reporting ISO 27001 SOC 2 Type II Data classification Encryption Cross-border transfer controls, documented lineage, and region-specific access policies 10–20 weeks Separate pricing for storage, processing, dashboards, and specialist engineering work 87/100
5 IT Service Management and End-User Support Standardizes service requests, reduces downtime, and improves employee support consistency. 18%–32% 8–18 months 24/7 or extended-hours support; priority-one response within 15–30 minutes Monthly service reviews, escalation procedures, and credits for repeated SLA misses ISO 20000-1 ISO 27001 Least-privilege access Follow-the-sun service desk, regional language coverage, and standardized ITIL processes 6–14 weeks Per-user or per-device pricing with clearly stated ticket-volume limits 85/100
6 Network Design and Secure Connectivity Improves connectivity resilience, supports distributed offices, and controls network operating costs. 17%–30% 14–28 months 99.9%–99.99% circuit or managed-network availability; 30-minute critical escalation Availability credits, documented failover testing, and incident postmortems ISO 27001 Network segmentation MFA Secure configuration baselines Multi-region carrier coordination, local installation partners, and redundancy planning 10–24 weeks One-time design, recurring circuit, hardware, and support costs shown separately 84/100
7 Enterprise Resource Planning Advisory and Implementation Improves process standardization, financial control, and visibility across multiple operating regions. 16%–29% 18–36 months Defined milestone acceptance, defect severity targets, and post-go-live support coverage Warranty period, remediation obligations, and formal change-control governance ISO 27001 Segregation of duties Audit trails Role-based access Localization for tax, currency, language, and statutory reporting requirements 24–52 weeks Phased pricing with implementation, licensing, training, and support costs itemized 82/100
8 Quality Assurance and Software Testing Reduces production defects, improves release confidence, and increases testing repeatability. 15%–27% 10–22 months Test-case execution targets, defect-response windows, and agreed release-readiness reporting Defect rework within severity-based correction periods and documented regression coverage ISO 27001 Secure test data handling Access logging Distributed testing teams, controlled remote access, and regional user-acceptance support 4–10 weeks Pricing by test scope, environment, automation coverage, and execution cycle 80/100
9 Technical Documentation and Localization Improves product adoption, reduces support demand, and supports consistent global operations. 12%–24% 12–24 months Defined terminology, review-cycle deadlines, and correction turnaround for approved content Revision commitments, terminology controls, and documented translation-quality reviews ISO 27001 Confidentiality controls Version control Regional language reviewers, translation-memory governance, and local regulatory adaptation 3–10 weeks Word-count, page-count, engineering-hour, and review fees disclosed separately 77/100
10 Technical Training and Change Enablement Accelerates user adoption, lowers process errors, and improves return on existing technology investments. 11%–22% 12–30 months Training-material delivery deadlines, attendance targets, and post-training support response times Content correction, replacement sessions, and agreed learner-support commitments ISO 27001 Controlled content access Privacy-aware learner data Virtual and in-person delivery, regional language options, and time-zone scheduling 4–12 weeks Facilitator, content-development, localization, travel, and platform costs itemized 74/100
Evaluation note: ROI figures are normalized market benchmark ranges for comparable technical-service engagements and should be validated against the buyer’s baseline costs, contract scope, implementation effort, utilization levels, and risk profile. SLA commitments, certifications, data-residency terms, and service-credit formulas must be confirmed in the final contract and evidence package.