
Computer Graphic Design Images are visual compositions created or refined with digital tools. They can include logos, posters, interface icons, product illustrations, and social media graphics. Some are built from pixels, like a photograph on a screen. Others use vector paths, which stay sharp when enlarged. That difference matters.
A designer may combine text, color, shapes, and photographs to guide attention or explain an idea. For example, a bright button against a quiet background can make an app action easier to notice. A printed event poster has different needs: its type must remain readable from several steps away. The software is only part of the process. Choices about contrast, spacing, scale, and file format affect how an image works across screens and print.
This guide explains what these images are, how common formats differ, and where they are used. It also introduces the tools and design decisions that shape a finished graphic. In practice, a technically clean image can still feel confusing or lifeless. I sometimes find that a small alignment change helps more than another decorative effect. Not always. Looking closely at purpose, audience, and viewing conditions gives readers a more reliable way to judge the result—and to create graphics that communicate clearly.
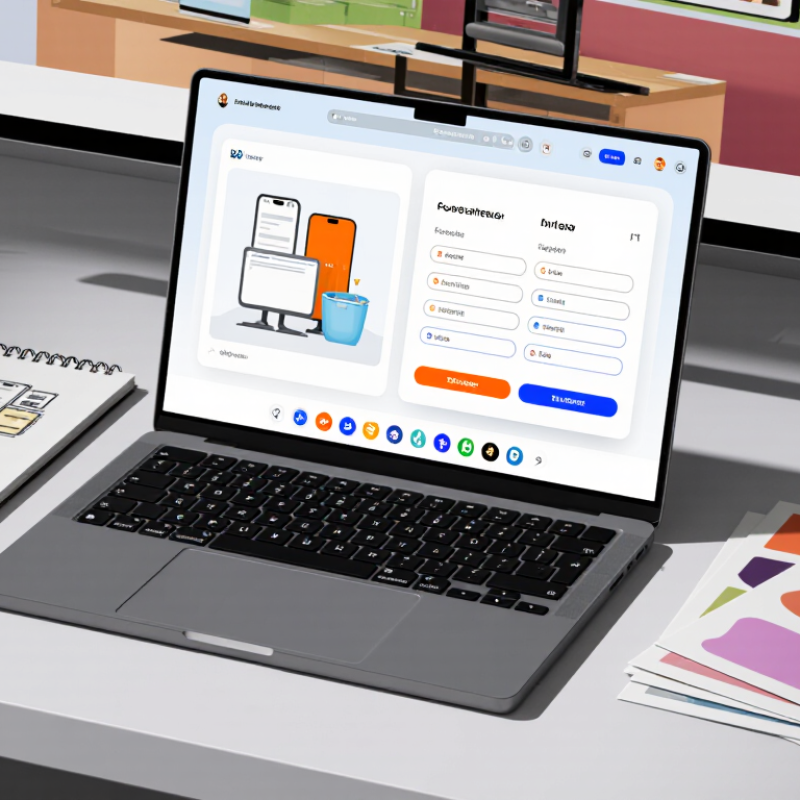
A computer graphic design image is a visual made or refined with digital tools to communicate a specific idea. It may combine typography, shapes, photographs, color, or 3D objects. Its purpose is practical: clarify information, direct attention, build recognition, or prompt action. On a phone screen, a clear icon and strong contrast can make the next step easier to spot. Small details matter.
The U.S. Bureau of Labor Statistics reported a 2023 median annual wage of $58,910 for graphic designers. It projected 2% employment growth from 2023 to 2033, with about 21,100 openings each year on average. These figures describe the occupation, not the value of any single image.
The World Economic Forum’s Future of Jobs Report 2025 lists graphic designers among roles employers expect to decline by 2030. That signals changing workflows, not an end to visual communication. A useful image still needs a clear audience, readable hierarchy, and accurate details. Aesthetic choices can overpower meaning; that is easy to miss during review. That tension deserves attention.
What Are Computer Graphic Design Images?
Core Visual Elements and Design Principles
Computer graphic design images combine shape, color, type, and space to communicate an idea on a screen or page. A warm orange circle can feel energetic; a narrow gray typeface may feel restrained. These choices are not decoration alone. They guide attention and influence how quickly a viewer understands the message.
Composition gives those elements a working order. Alignment creates clear edges, while contrast separates a headline from a pale background. Repetition, such as using the same corner radius on several cards, builds visual rhythm. White space matters too. It gives crowded details room to breathe. I often test a layout at phone size, because a carefully balanced desktop design can become cramped on a small display.
Good design principles are useful, not absolute. A strict grid may improve clarity, yet an intentional break can make an important image feel more alive. Still, exceptions need a reason. If every element competes, the viewer has nowhere to look. I sometimes over-adjust spacing, and the result can feel stiff; stepping away helps reveal that. Small revisions—moving a caption, softening a shadow, or enlarging a key icon—can change the image’s tone without adding more content.
Computer graphic design images communicate ideas through pixels, paths, shapes, and text. Their format affects how they look, scale, and print. Choosing the right type early can prevent blurry edges or oversized files later.
Raster images are made from tiny colored pixels. Photographs and textured artwork often use this format. Zoom in closely, and edges may look blocky. Vector images use mathematical paths instead, so logos, diagrams, and simple illustrations stay crisp at different sizes. They are not ideal for every painterly effect, though.
There are more options. 3D graphics show depth, lighting, and surfaces, making them useful for product mockups or architectural scenes. Icons simplify objects into clear symbols, while infographics combine shapes, labels, and data to explain a topic quickly. Typography-based graphics treat letters as visual elements; spacing and weight matter as much as the words. A tiny label can change the whole feel.
These categories can overlap. A poster might combine a photograph, vector lettering, and small icons. That mix is common. Still, designers should check contrast, resolution, and readability at the final display size. A design that looks sharp on a large monitor may lose detail on a phone.
What Are Computer Graphic Design Images?
How Computer Graphic Design Images Are Created
Computer graphic design images begin with a clear purpose: explain an idea, guide attention, or create a specific feeling. The designer studies the audience, message, and final use before opening a design program. A small phone graphic needs larger text and simpler shapes than a poster viewed across a room. Rough sketches help test the layout before details consume time. Sometimes the first sketch is awkward. That is useful.
Next, the designer builds the image with shapes, photographs, typography, or a mix of these elements. Vector shapes stay crisp when resized, while raster images work well for detailed textures and photos. Layers keep text, color, and artwork adjustable. A limited palette can help the main subject stand out, but contrast also matters for readability. I have found that tiny spacing changes can make a layout feel calmer, though it is easy to overwork them. Feedback from someone unfamiliar with the project often reveals confusing details. The image is then checked at its intended size and exported in a suitable file format. A final check can catch clipped edges, fuzzy lettering, or colors that look different on screen.
Graphic design images are created by arranging visual elements on a canvas in raster or vector software. This chart compares the approximate pixel width and height of common print formats at 300 pixels per inch (ppi), rounded to the nearest pixel. Actual canvas dimensions depend on the intended output and workflow.
Computer graphic design images move between screens and physical pages. A social post needs clear contrast on a small phone, while a poster must remain legible from several steps away. Designers adjust image size, color, and spacing for each setting. A layout that feels balanced on screen may look crowded in print.
The scale is significant. DataReportal’s Digital 2024 report counted 5.04 billion internet users worldwide at the start of 2024, about 62.3% of the global population. Digital graphics therefore need to work across varied devices, connection speeds, and viewing conditions.
A compressed image can load quickly, but excessive compression may soften fine lines or small text. Small details matter.
Print still has substantial reach. Smithers’ The Future of Global Printing to 2027 valued the worldwide print market at $818.8 billion in 2022 and projected $834.3 billion for 2027. In brochures, packaging, and signs, designers must consider paper texture, ink coverage, trim, and viewing distance.
A warm screen color may print duller, so a physical proof can reveal problems before a large run. Even careful proofs are imperfect; lighting and paper batches can shift the result.
